Compound Interest: Why Starting Early Beats Finding a Better Rate
What compound interest is, the formula behind it, and honest arithmetic showing why ten extra years of compounding beats two extra points of return
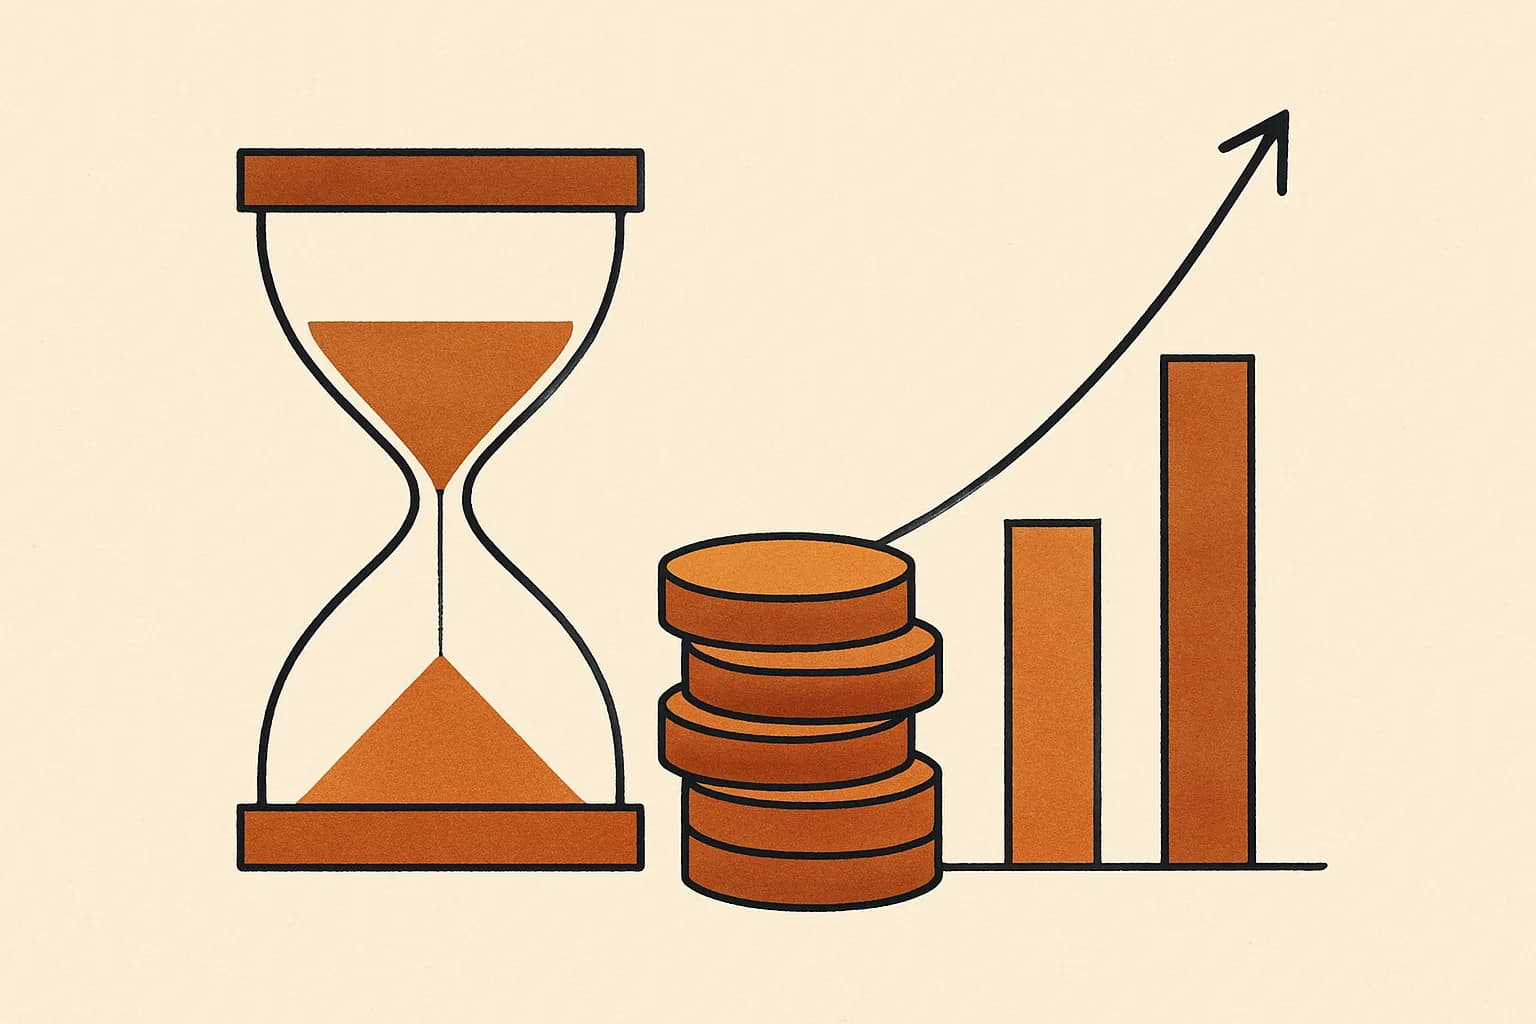
Compound interest is interest paid on interest you have already earned. Deposit $10,000 at 5% and the first year pays $500 — the same $500 simple interest would pay, because at the start there is only principal to pay on. The difference appears in year two. Simple interest is always figured on the original deposit, so it hands you another $500. Compound interest first adds year one's $500 to the balance, then pays 5% of $10,500 — $525. Year three pays 5% of $11,025, which is $551.25. The gap opens at $25 and never stops widening, because each year's interest joins the principal and starts earning interest of its own.
That feedback loop makes the growth exponential rather than linear, and exponential growth has a property that surprises nearly everyone who meets it: the input that dominates the outcome is not the interest rate. It is how long the loop is allowed to run. This is the time-vs-rate question, and this post works the arithmetic behind it in full, using the same formula and the same worked example the compound interest calculator prints beside its results — every figure here can be checked by hand.
The formula, and a ten-second example
A = P(1 + r/n)^(nt)
P is the starting principal, r the annual rate as a decimal, n how many times per year interest is credited, and t the number of years. The classic first exercise — the one Brealey, Myers and Allen open Principles of Corporate Finance with — is $1,000 at 7%, compounded once a year, for ten years. The growth factor is 1.07^10 = 1.96715, so the ending balance is 1,000 × 1.96715 = $1,967.15. Nearly half of that — $967.15 — is interest, and it did not arrive evenly: the account earns 1,000 × 0.07 = $70 in year one but $128.69 in year ten (7% of the $1,838.46 the balance has reached by then). Same deposit, same rate, almost double the interest — purely because the later years pay interest on all the interest that came before.
When you also deposit money every month, a second term joins the formula — the future value of the contribution stream, PMT × [((1 + r/n)^(nt) − 1) ÷ (r/n)] — but the exponent (nt) drives both terms, and the exponent is where time lives.
Money doubles on a schedule
The Rule of 72 says money doubles roughly every 72 ÷ rate years. At 7%, that is 72 ÷ 7 ≈ 10.3 years per doubling.
Doublings are the cleanest way to see why an early start wins. A dollar invested at 25 has time for four doublings by 65: $1 → $2 → $4 → $8 → $16. The same dollar invested at 35 gets three and stops at $8. (The rule is an approximation; the exact factors at 7% are 1.07^40 = 14.97 and 1.07^30 = 7.61 — the shape of the argument survives the correction.) Notice what the late start actually forfeits: the final doubling, $8 to $16, adds as much as everything that came before it combined. Compounding is back-loaded, and the years you cut come off the back.
Time versus rate, head to head
The compound interest calculator ships with this worked example: $10,000 to start, $500 added at the end of each month, 7% compounded monthly, for 30 years. It projects $691,150.47, of which only $190,000 was contributed — $10,000 up front plus 360 × $500 = $180,000 in deposits. The other $501,150.47 is growth: 501,150 ÷ 691,150 = 0.725, so 72.5 cents of every ending dollar was earned, not deposited.
Now improve that scenario two different ways — hunt a better return, or start sooner:
| Scenario | Ending balance | Gain over baseline |
|---|---|---|
| Baseline: 7% for 30 years | $691,150 | — |
| One extra point: 8% for 30 years | $854,537 | +$163,387 |
| Two extra points: 9% for 30 years | $1,062,678 | +$371,527 |
| Same 7%, ten extra years: 40 years | $1,475,521 | +$784,370 |
Ten extra years at a plain 7% beats two extra percentage points held for three full decades, and it is not close. To keep the comparison honest: the 40-year run does include ten more years of deposits — $500 × 120 = $60,000 more out of pocket. Strip that out and the time advantage is still $784,370 − $60,000 = $724,370 of pure additional growth.
There is a second asymmetry hiding in that table. Starting ten years earlier is a decision; earning 9% instead of 7% every year for thirty years is a hope. Nobody gets to choose two extra points of market return, and chasing them usually means concentrated bets, higher fees, or both. Time is the only input in the formula you can simply decide to have more of.
Two savers, one missing decade
Run the classic pairing. Saver A invests $300 a month — $3,600 a year — from age 25 to 65. Saver B waits until 35, then invests double: $600 a month, $7,200 a year, until 65. Both earn 7% compounded annually, which keeps the arithmetic short enough to check on paper:
- Saver A: 3,600 × [(1.07^40 − 1) ÷ 0.07] = 3,600 × 199.635 = $718,686, from 3,600 × 40 = $144,000 contributed.
- Saver B: 7,200 × [(1.07^30 − 1) ÷ 0.07] = 7,200 × 94.4608 = $680,118, from 7,200 × 30 = $216,000 contributed.
Saver B put in $72,000 more ($216,000 − $144,000) and still finished $38,568 behind ($718,686 − $680,118). Doubling the contribution did not buy back the missing decade — because the dollars that matter most are the earliest ones, and those were never invested.
The one rate worth fighting for
None of this makes the rate irrelevant. It means the rate worth fighting for is the one you control: the fee. Rerun the baseline scenario at 6% instead of 7% — which is exactly what a 1% annual expense ratio does to a 7% gross return — and the ending balance falls to $562,483. The gap, $691,150 − $562,483 = $128,667, is the compounded cost of surrendering a single percentage point every year for thirty years. Fees run on the same machinery as every table above, pointed the other way.
Compounding frequency — the other knob people agonize over — matters far less than its reputation suggests. A 7% nominal rate compounded monthly works out to an effective annual rate of (1 + 0.07/12)^12 − 1 = 7.229%, and the step from monthly to daily adds almost nothing. The future value calculator reports that EAR on every run, and it also inverts the whole formula: hand it a target balance and it solves for the monthly payment you would need, or the years it will take.
Where the curve is pointed
Compounding needs a finish line, and the standard one comes from William Bengen's 1994 safe-withdrawal-rate paper and the Trinity Study: a portfolio of about 25 times annual spending has historically sustained a 4% inflation-adjusted withdrawal over a 30-year retirement. Spend $40,000 a year and the target is 40,000 ÷ 0.04 = $1,000,000. The retirement and FIRE calculator runs the full projection — in its worked example, a saver with $50,000 already invested who banks $60,000 a year at a 7% real return crosses that $1,000,000 line in about 10.6 years.
One caveat belongs at the end. Every table above is deterministic: it assumes 7% shows up on schedule each year, and no real market has ever been that polite. Returns arrive in lumps, and once you begin withdrawing, the order of the lumps matters. So use these numbers to rank strategies rather than to predict a balance. The ranking, though, holds under any reasonable assumption, and it always ends the same way — start the clock, because a decade of compounding is the one asset no future rate can replace. Swap in your own balance, rate, and horizon and the calculators above will rerun every scenario in this post in under a minute; the rest of Quanta picks up the questions that come next, from savings goals to payoff schedules. Requests for the next head-to-head — a different pair of levers, worked with the same open arithmetic — go through the contact page.